I have been interested in CUDA for a long time, and while I've read a few books on CUDA, I have not actually gotten my hands dirty with it, yet. It's time to remedy that situation with this new blog series where I explore CUDA programming with a purpose. The end goal is to create a CUDA program that runs a scalable, multi-body gravity simulation on my GPU. Maybe I'll even draw what's being simulated on the screen. I'm not sure at this point how big I'll be able to make this simulation, but I think it'll be a good way to dive into CUDA and see what it's all about. The real goal here is to experiment, fail, struggle, and learn while having some fun doing it.

In the Beginning There Was Hello, World
First things first, we need to figure out how to run a CUDA program on our GPU, and since the best program to start with is Hello, World, that is where we'll begin. I have an nVidia GeForce GTX 1050 card, so the following experimentation in drivers and the environment will all correspond to that GPU. Different cards may need different driver versions or other setup minutiae to get them working, so YMMV. Having said that, I found the CUDA environment setup to be pretty painless, at least on Windows. To set up your own CUDA environment, just follow these steps:
- Download and install Visual Studio Community 2019 (or later versions). Yes, the CUDA environment integrates with VS, so you get all of the code editing and debugging tools from Microsoft. If you have the Pro or Enterprise versions, good for you; those work, too.
- Download and install CUDA Toolkit 11.1 (or later versions).
- While steps 1 and 2 take a really long time, there is no step 3.
I can't say much about the process on Linux, since I don't have a Linux machine running with a CUDA-capable card. Actually, I can say that I have a friend who did some work on a video image recognition ML project using CUDA on Linux, and he said the setup was a nightmare of aligning Linux distro version, toolkit version, and driver version with his card. I can imagine that getting messy, but you also might get lucky with a well-supported setup. It looks like nVidia does have a number of officially supported setups for Linux on their CUDA Toolkit download page. Anyway, those are the joys of programming environment setup for you.
Getting back to the task at hand, we just need to fire up VS and create a new project using the CUDA 11.1 Runtime template:

Click "Next" and enter a project name like "hello_world." Change the location if you wish, and then click "Create." Wait a few minutes for VS to do its thing (at least on my decrepit machine; yours is probably faster), and we're presented with a working project that adds two arrays of numbers using CUDA. While this type of program is probably a more appropriate first CUDA program, we're going to ignore it for now, delete everything except the initial #includes, and replace it with this code:
#include "cuda_runtime.h"
#include "device_launch_parameters.h"

#include <stdio.h>

__global__ void helloFromGPU(void) {
    printf("Hello, World from GPU!\n");
}

int main() {
    printf("Hello, World from CPU!\n");
    helloFromGPU<<<1, 10>>>();
    cudaDeviceReset();
}
As we can plainly see from main(), this program should at least print out "Hello, World from CPU!" But then it does this weird function call with a <<<1, 10>>> stuck in between the function name and the parentheses. What that call does is load that function, referred to as a kernel in CUDA-speak, on the GPU and replicate it on 10 identical threads that run on 10 identical cores (we'll get to what the "1" means eventually, but not now). That means we should see 10 printouts of "Hello, World from GPU!" If we click the play button for the Local Windows Debugger, we'll see exactly that:

That is pretty slick! We have our first CUDA program running on the GPU using multiple cores, and it even does printing to the console. Alright, now that we know our environment is set up properly, let's go back to the template program that VS had created for us and we had summarily deleted and see what that's all about.
A Real First CUDA Program
Hello, World doesn't really do CUDA programming justice—it's just printing instead of computation—so we're going to figure out what's going on behind the scenes with a more interesting program. Here's the template program that VS creates for us with a new project:
#include "cuda_runtime.h"
#include "device_launch_parameters.h"

#include <stdio.h>

cudaError_t addWithCuda(int *c, const int *a, const int *b, unsigned int size);

__global__ void addKernel(int *c, const int *a, const int *b) {
    int i = threadIdx.x;
    c[i] = a[i] + b[i];
}

int main() {
    const int arraySize = 5;
    const int a[arraySize] = { 1, 2, 3, 4, 5 };
    const int b[arraySize] = { 10, 20, 30, 40, 50 };
    int c[arraySize] = { 0 };

    // Add vectors in parallel.
    cudaError_t cudaStatus = addWithCuda(c, a, b, arraySize);

    printf("{1,2,3,4,5} + {10,20,30,40,50} = {%d,%d,%d,%d,%d}\n",
        c[0], c[1], c[2], c[3], c[4]);

    cudaStatus = cudaDeviceReset();

    return 0;
}

// Helper function for using CUDA to add vectors in parallel.
cudaError_t addWithCuda(int *c, const int *a, const int *b, unsigned int size) {
    int *dev_a = 0;
    int *dev_b = 0;
    int *dev_c = 0;
    cudaError_t cudaStatus;

    // Choose which GPU to run on, change this on a multi-GPU system.
    cudaStatus = cudaSetDevice(0);

    // Allocate GPU buffers for three vectors (two input, one output)    .
    cudaStatus = cudaMalloc((void**)&dev_c, size * sizeof(int));
    cudaStatus = cudaMalloc((void**)&dev_a, size * sizeof(int));
    cudaStatus = cudaMalloc((void**)&dev_b, size * sizeof(int));

    // Copy input vectors from host memory to GPU buffers.
    cudaStatus = cudaMemcpy(dev_a, a, size * sizeof(int), cudaMemcpyHostToDevice);
    cudaStatus = cudaMemcpy(dev_b, b, size * sizeof(int), cudaMemcpyHostToDevice);

    // Launch a kernel on the GPU with one thread for each element.
    addKernel<<<1, size>>>(dev_c, dev_a, dev_b);

    // cudaDeviceSynchronize waits for the kernel to finish, and returns
    // any errors encountered during the launch.
    cudaStatus = cudaDeviceSynchronize();

    // Copy output vector from GPU buffer to host memory.
    cudaStatus = cudaMemcpy(c, dev_c, size * sizeof(int), cudaMemcpyDeviceToHost);

    cudaFree(dev_c);
    cudaFree(dev_a);
    cudaFree(dev_b);

    return cudaStatus;
}
This program takes two vectors of five elements each and adds them together. The trick is that each addition of a pair of elements happens on a different core in the GPU because they are each done in their own thread. The setup of these threads is all done in the function addWithCuda(), and the kernel is called about midway down this function with addKernel<<<1, size>>>(). The size parameter is the size of the arrays, so a unique thread is created for each element in the arrays. The other statements are allocating memory on the GPU, moving vectors back and forth between the main memory and GPU, and freeing the memory on the GPU. I left the comments in so the steps are fairly self-explanatory in the code.
I did, however, strip out the error reporting to make the steps a bit more clear. Everywhere that a CUDA function returns a value that's assigned to cudaStatus, this return value could potentially be an error that should be checked and reported for easier debugging.
Now, looking at the addKernel function, we can see a new variable called threadIdx.x. This variable isn't declared anywhere in this program because it's part of the CUDA runtime. It gives each thread running on the GPU access to the index it's doing its calculations for, and from the .x element access we can gather that there are potentially other dimensions to the thread index. This calculation only uses one-dimensional arrays, but CUDA can handle 2D data as well, where the second dimension index is accessed with the obvious threadIdx.y. This feature makes 2D calculations much more convenient.
Okay, if we click the play button again, we can see this program run as well:

Alright, very exciting; we can add! So what else can we do with this CUDA environment?
What's In This GPU Anyway?
To take full advantage of whatever GPU hardware we're running on, and write scalable programs that can optimally run on different levels of hardware, we need to know what our GPU hardware is capable of. Fortunately, nVidia has already thought of this, and even more fortunately, they have provided a set of example programs and optimized libraries with the CUDA toolkit that includes a program that queries the CUDA devices present in the system. If we load the VS solution that by default is installed at C:\ProgramData\NVIDIA Corporation\CUDA Samples\v11.1\Samples_vs2019.sln, we can find the deviceQuery project under the 1_Utilities folder in the Solution Explorer.

This program is much lengthier than the others, and more boring. It's mostly a bunch of queries of the CUDA devices in the system and printouts of what it finds. It's hardly worth showing. There's not even any kernel, as all of the info can be gleaned from the host thread, but here's a snippet from main() to get a sense of how the code works:
int main(int argc, char **argv) {
  pArgc = &argc;
  pArgv = argv;

  printf("%s Starting...\n\n", argv[0]);
  printf(
      " CUDA Device Query (Runtime API) version (CUDART static linking)\n\n");

  int deviceCount = 0;
  cudaError_t error_id = cudaGetDeviceCount(&deviceCount);

  if (error_id != cudaSuccess) {
    printf("cudaGetDeviceCount returned %d\n-> %s\n",
           static_cast<int>(error_id), cudaGetErrorString(error_id));
    printf("Result = FAIL\n");
    exit(EXIT_FAILURE);
  }

  // This function call returns 0 if there are no CUDA capable devices.
  if (deviceCount == 0) {
    printf("There are no available device(s) that support CUDA\n");
  } else {
    printf("Detected %d CUDA Capable device(s)\n", deviceCount);
  }

  int dev, driverVersion = 0, runtimeVersion = 0;

  for (dev = 0; dev < deviceCount; ++dev) {
    cudaSetDevice(dev);
    cudaDeviceProp deviceProp;
    cudaGetDeviceProperties(&deviceProp, dev);

    printf("\nDevice %d: \"%s\"\n", dev, deviceProp.name);

    // Console log
    cudaDriverGetVersion(&driverVersion);
    cudaRuntimeGetVersion(&runtimeVersion);
    printf("  CUDA Driver Version / Runtime Version          %d.%d / %d.%d\n",
           driverVersion / 1000, (driverVersion % 100) / 10,
           runtimeVersion / 1000, (runtimeVersion % 100) / 10);
    printf("  CUDA Capability Major/Minor version number:    %d.%d\n",
           deviceProp.major, deviceProp.minor);

    char msg[256];
    sprintf_s(msg, sizeof(msg),
             "  Total amount of global memory:                 %.0f MBytes "
             "(%llu bytes)\n",
             static_cast<float>(deviceProp.totalGlobalMem / 1048576.0f),
             (unsigned long long)deviceProp.totalGlobalMem);

    printf("%s", msg);
And it goes on and on. Notice that we're able to grab a lot of device properties from the library call cudaGetDeviceProperties(), and those properties can be used to decide how we want to partition our problem when running on different GPUs. Some of these queries will be very useful for optimizing algorithms in a GPU-agnostic way. We can run this program on our system right now to see what its actual capabilities are as well, but this program should be built as a release build (not debug!) and run from the command prompt for it to work. When it's done, I get this for my GTX 1050:
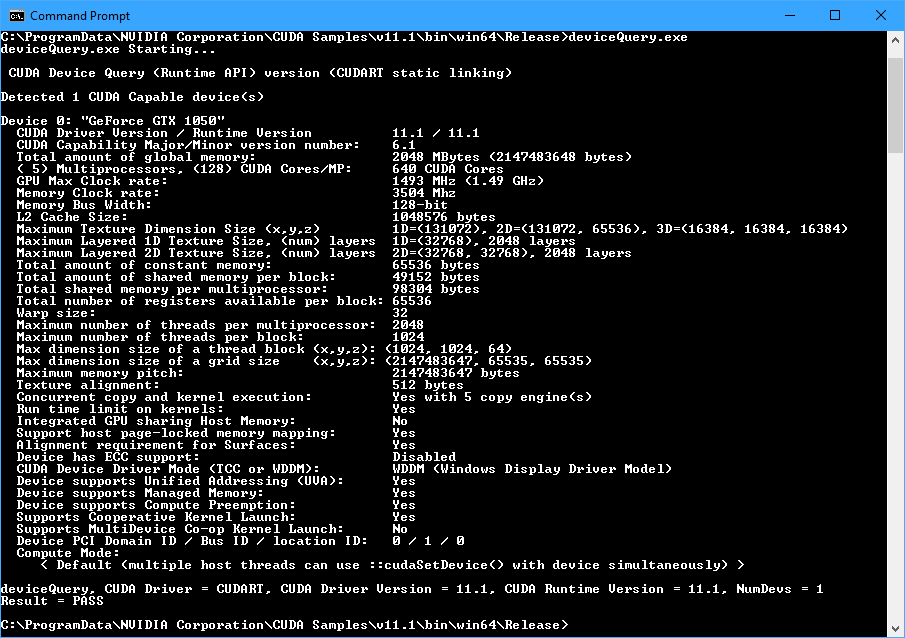
I can see that it is indeed a GeForce GTX 1050 card with 2GB of memory running at 3.5GHz, 640 CUDA cores running at 1.5GHz, and a CUDA capability of 6.1, along with many other parameters. That CUDA capability is important for knowing what CUDA features are available on the hardware. Each GPU generation adds more features, and knowing the CUDA capability can allow programs to use those features conditionally for better performance or fall back on a different solution if the desired feature isn't available. Okay, this is all great stuff, but let's ends with something a bit more flashy.
Wow Me
There are dozens of sample programs provided in this toolkit, so I wanted to take a look at something a bit more impressive. Looking in the 2_Graphics folder, the Mandelbrot project caught my eye. This code is significantly more involved than the other code we've looked at, so I'm not going to analyze it here. Just know that the Mandelbrot set is an infinite fractal that can be drawn and zoomed in on to see all sorts of interesting patterns. The calculations for coloring the pixels are also very parallelizable. This program once again built and ran without a hitch, and here is what it looks like:

And here's another view after zooming in on one of those filament-like structures off of the circle to the left of the main blob:

Huh, looks like there's another similar shape to the full Mandelbrot set hiding inside that filament. There's actually more if we zoom into the filaments seen here or even go further into the Mandelbrot shape in the center and find filaments in there to zoom in on. There's all kinds of patterns that repeat at essentially infinite zoom levels. This particular Mandelbrot viewing program is a bit rough, so it can't zoom to the extreme magnitudes that a more optimized program could. But we can see some extremely cool examples of it on YouTube with better color rendering:
These Mandelbrot zooms can get real trippy real fast, and there's a ton of them, so be careful going down this YouTube rabbit hole. Even though the sample program doesn't look as good as this, it's still awesome to see something this complex running on my own GPU with less than an hour of effort.
This is a pretty good place to stop for this episode. We got a Hello, World program running with CUDA, saw how a real CUDA program works to add two vectors in parallel, learned how to query the GPU for all of its specs, and even ran a fairly complex and computation-intensive parallel program on the GPU. That's a solid start on my goal of writing a multi-body gravity simulation, and there's probably some other useful stuff in the sample programs provided with the CUDA toolkit. I'll definitely be able to use some of the drawing code in the samples to make a visual representation of the sim. That will have to wait for another time, though. Next episode we'll be learning about gravity.
No comments:
Post a Comment